The state of South Australia is introducing a new “score-on-the-door” food hygiene safety rating for cafes and restaurants as the State Government overhauls the Public Health Act.
Scores on doors sounds better.
Adelaide Now reports the Government wants food businesses to adopt the system, with a score out of five displayed on a shop’s door according to its level of food-safety  compliance.
It is also planning to adopt a new statewide food safety standard and introduce a registration system for food outlets as part of the reforms.
Hundreds of outlets are caught each year for serious breaches of food hygiene standards.
Health inspectors found rotten meat, maggots in chicken stuffing, puddings with listeria and mice in pantries at cafes, restaurants and takeaway food outlets last financial year.
A parliamentary committee investigation into food safety programs last September recommended the introduction of a statewide score-on-the-door rating system.
Health Minister Jack Snelling said SA Health would work with other jurisdictions, including NSW and with local government and industry, during the development of the system.
A pilot “scores on doors” project is expected to be introduced on a voluntary basis next year. Similar schemes are running in London, Los Angeles, Singapore, Brisbane and Sydney.
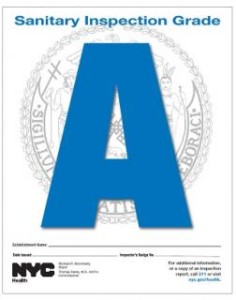
But the best ones, like Los Angeles, New York City and Toronto are not voluntary; sorta defeats the purpose.
The Restaurant and Catering SA association said the score system would mean more red tape to businesses. “We would prefer to see a policy which endorses training of staff (in  food safety),” chief executive Sally Neville said.
Why not both?
We have some experience with restaurant inspection disclosure systems.
The World Health Organization estimates that up to 30% of individuals in developed countries become ill from food or water each year. Up to 70% of these illnesses are estimated to be linked to food prepared at foodservice establishments. Consumer confidence in the safety of food prepared in restaurants isfragile, varying significantly from year to year, with many consumers attributing foodborne illness to foodservice. One of the key drivers of restaurant choice is consumer perception of the hygiene of a restaurant. Restaurant hygiene information is something consumers desire, and when available, may use to make dining decisions.
The World Health Organization estimates that up to 30% of individuals in developed countries become ill from contaminated food or water each year, and up to 70% of these illnesses are estimated to be linked to food service facilities. The aim of restaurant inspections is to reduce foodborne outbreaks and enhance consumer confidence in food service. Inspection disclosure systems have been developed as tools for consumers and incentives for food service operators. Disclosure systems are common in developed  countries but are inconsistently used, possibly because previous research has not determined the best format for disclosing inspection results. This study was conducted to develop a consistent, compelling, and trusted inspection disclosure system for New Zealand. Existing international and national disclosure systems were evaluated. Two cards, a letter grade (A, B, C, or F) and a gauge (speedometer style), were designed to represent a restaurant’s inspection result and were provided to 371 premises in six districts for 3 months. Operators (n = 269) and consumers (n = 991) were interviewed to determine which card design best communicated inspection results. Less than half of the consumers noticed cards before entering the premises; these data indicated that the letter attracted more initial attention (78%) than the gauge (45%). Fifty-eight percent (38) of the operators with the gauge preferred the letter; and 79% (47) of the operators with letter preferred the letter. Eighty-eight percent (133) of the consumers in gauge districts preferred the letter, and 72% (161) of those in letter districts preferring the letter. Based on these data, the letter method was recommended for a national disclosure system for New Zealand.
